
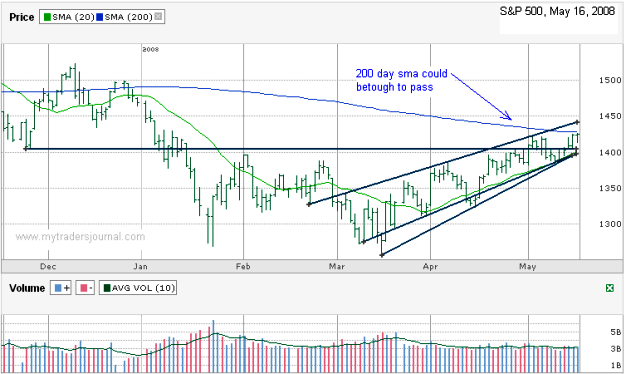
I mentioned in last week’s Dow Jones Chart that I thought support was showing and the DJIA could tick higher. It did. I came back this week to chart the S&P 500 ($SPX.X). This is a six month chart of the S&P 500 as opposed to the slightly longer chart last week and therefore has slightly different lines to draw our focus.
The primary negative (bearish) technical indicator I see is the 200 day simple moving average (sma) acted as a ceiling last week on Thursday and Friday. The 200 day line can be a hard line to cross and this time proved no different so far. Then again on the positive (bullish) side the S&P has stayed above the 1400 mark for a few days. We’ve been jockeying back and forth across 1400 for a few weeks. With the upward trend lines of higher lows reaching 1400 at the same time as the 10 and 20 day moving averages moving up to provide further support, the path of least resistance could be up.
Earnings season provided more fuel for the bulls’ argument, but I have to continue to ask when will such high oil prices dampen the run. I think we’re due for a pull back, even if the only reasons are oil and the 200 day moving average. I admit the trading channel we’re in now looks pretty convincing to think going up further is likely, but those are two powerful forces that haven’t been dealt with in a long time that can’t stay locked in the basement too long.
Hello,
I found a free site that screens for the highest percentage covered calls each day and have been pretty sucessful writing the covered calls with 1/2 of my postion money and then waiting for a pull back and selling puts under and out of the money with the second 1/2. I would like to add a few put positions all by themselves, but have not been able to find a site that screens for the highest percentage out of the money puts. Do you know of any sites that do this?
Thanks in advance,
Jim
Jim, I don’t know know any sites that give free high premiums for puts in particular, but I’d imagine that the same stocks that offer high premiums for calls do the same for puts most of the time. They tend to move in sync. coveredcalls.com used to be one I used, but haven’t even looked at it in years.