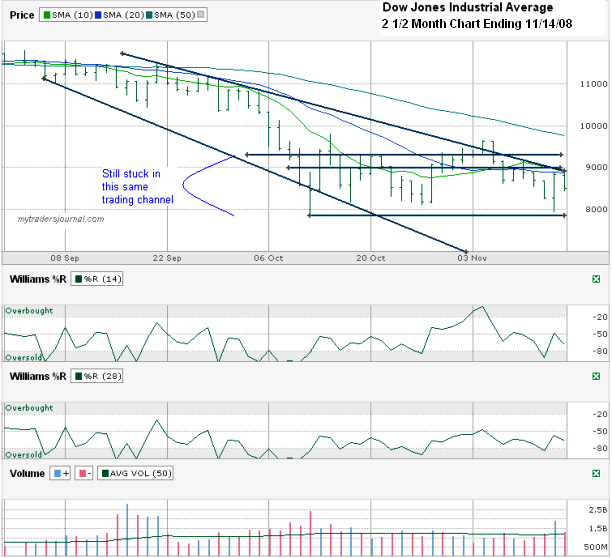
I went back to the beginning of September 2008 and charted the daily price action for the Dow Jones Industrial Average, aka DJIA ($DJI). We’ve seen days over the past two months move more in a single day than the DJIA sometimes moves in an entire year. The odd part is that many of us are getting accustomed to it. At 3:00 or even 3:45 or 3:55 I still wonder if the Dow will finish up or down 100 points from where it is trading at that moment. What’s interesting to me is to chart the Dow and realize that we are still stuck in the same trading channel we’ve been in for more than a month. We’ve snuck out to the top side on a few occasions, but the floor is starting to look a little more firm. This week, options expiration week, will be telling.
The DJIA bounced when it came very close to the October lows, but gave half of it back the next day when it hit the two month down trending line of lower highs. That happened to coincide with the top side of the trading channel and the 10 and 20 day moving averages. That was a lot of technical muscle to try to power through and the Dow didn’t have the strength for it.
This week’s Barron’s points out that we are on pace to record the third most volatile month in the past five decades behind October 1987 and last month, October 2008. I enjoy being able to witness history, but I feel I’ve had my fill now. I have enough stories to tell grandkids one day that I’ll be happy to see the Dow move in smaller moves, preferably upward. I made no trades last week. I can’t recall the last time I’ve skipped a week. I made only three trades the week before. I have no trades planned for the next few days either. I’m ready for November options to expire in five days and let me reload for the next turkey shoot. If luck can shine on me we’ll be back at the top side of the trading range and I can sell new covered calls while the prices for stocks are higher.
I don’t see that the market is ready to break out of this pattern yet. The catalyst could come when we have a sustained two plus day close above the downward trending line I mentioned above. That could be more possible now that this trend line is inside the trading channel. I don’t plan to put any extra money on the line to test that theory though.


We’re watching a mechanical move where everybody who is a profesisonal is using this move to get short long term out when we break back down and head much lower.
Does this show promise for the market right now. It might be on a rebound which could be very promising for the market. If this is the case we could see a significant turn around in investor confidence. I think it could be flattening out.
I think my newer chart of the S&P 500 shows more of a flattening now that we’ve taken another hit.
http://mytradersjournal.com/stock-options/2008/11/19/sp-500-chart-november-19-2008/