
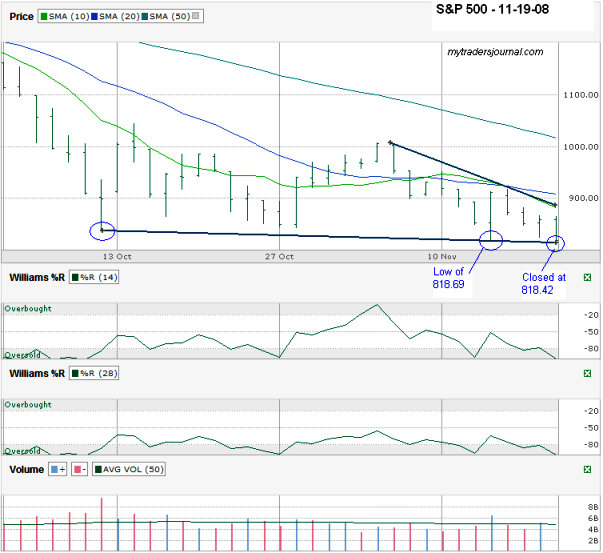
I’m posting a chart of the S&P 500 ($SPX.X) mid-week in honor of the new 5 1/2 year low. The Dow Jones is down there too, but I’m more interested in the $SPX since I have a decent sized play on SSO, the double the $SPX ETF. Again today I didn’t make a trade as I stood like a deer in headlights. Most technical traders were looking for support at 819. We closed below that mark by 13 points at 806. That could have turned into a landslide, but didn’t yet probably because we ran out of time. Tomorrow will be interesting to see if the last 30 minutes of the day is a sign of what’s to come.
What I like about this S&P 500 chart is that I can draw a trend line from the October 16th low through the lows of the end of October and last week’s low to today’s low. Not that I like a trend line of lower lows, but I do like a trend line that hasn’t broken yet. What’s scary is the trend line of lower highs that’s chasing the ceiling of the SPX lower too. Also, the trend line from October 11th through last week’s low broke in the last 30 minutes of the day. That causes me some gitters tonight.
I had a paper profit of well over $1,000 on my SSO naked puts at November 22 and 25 strikes. I didn’t take the profits thinking that the index wouldn’t dive that fast again before this Friday. You’d think I’d learn to hedge in this market. SSO closed at 22.18 today. Depending on the next two day’s price action, I might not buy back the puts, take the share assignments and wait for a rebound with covered calls sold. My account hit a new 20 month low again today led by DRYS, but that’s for another post.

What we saw today was a break of the 777 and an intra day bounce off those levels. This is strictly mechanical and is due to options expiration. You can trade the call side today but I would be out by the end of the day.
Market is trend down and I think it may take a little bit more time to see the trend reverse. It is better wait and see.
Hey dude, I think we are now in the last leg of bottoming out. You can as well check with historical data that we have reached support from 2002-2003 levels. Check out DOW Jones for example, bounced back from the 2002-2003 levels on Nov 21, 2008.
S&P has touched the low and I think there might be short term rebound soon.