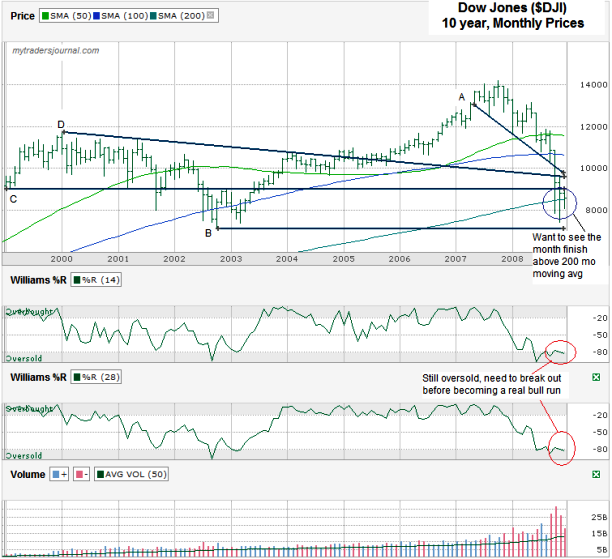
I charted the Dow Jones Industrial Average (aka DJIA or $DJI and previously $INDU) for the past 10 years using monthly price ranges as of Friday’s close. I was planning to chart the 20 year view, but most of what seemed more interesting has happened over just the past 10 years. I made notes on the chart below to highlight what I see. I usually chart daily or weekly prices in my weekend charts, but occasionally like to chart the monthly view to see longer term trends. My comments below are an attempt to predict where longer moves might take us, not where we’ll be over the next week or two.
- Williams %R Indicator – To really see sustained movement in a stock or index the Williams %R needs to break out of either grey area, oversold or overbought. The DJIA has been stuck down in the oversold area for the past few months and hasn’t made a real movement out of it yet to signify we’re moving into a longer bull run yet. This shows me that we’re not in the clear yet to move much to the upside yet.
- 200 Month Moving Average – The DJIA has moved below its 200 month moving average for three months in a row. We haven’t closed below it yet, but we’re teetering on the line right now, so the next few days up to the end of the month could be telling. Closing the end of the month below that line is bearish. Closing above it isn’t quite bullish yet since we keep dipping below. We need to see the DJIA stay above its 200 day moving average for two months to really feel like the bull could be more than walking near us.
- 50 and 100 Month Moving Averages – They are both so far north of the current price it’s only worth noting that they could be a bump in the road whenever we get back up there. Don’t expect that day to come in the very near term.
- Trend Line A – The trend line I marked with an “A” was the support line that marked the declining move to lower lows for more than a year. Many technicians (sadly not me) jumped ship once that line broke and the result was a nose dive in the Dow Jones’ stocks. That same line will most likely act as a ceiling on the way back up. Don’t expect to pass Dow 10,000 in the near term.
- Trend Line B – This is the last ditch line of support if November’s low breaks support. It’s the low from 2002. If it breaks we could easily see another group of technicians loading up the sell orders.
- Trend Line C – This line was support for a few years and then became a ceiling in 2002 and one month in 2003 before becoming support again soon after. The same line could come into play again in 2009, but it’s a weaker line to consider.
- Trend Line D – It could also be a fairly weak line maybe, but worth watching. It cuts through the middle of the decade, but then acted as a ceiling again in November, last month. It’s intersection with Line A could add to its clout.
I’m not expecting a big sustained move higher yet, but I’m not naive enough to think I’m I am a fortune teller who can guarantee the future. I’ll be ready and waiting to get back in deeper if I think a turn upward has some staying power. Until I’m convinced I’ll be tentative with my moves.
For an interestestly look back at my five year DJIA chart from the beginning of the 2008, head here. Not to pat myself on the back too hard, but 11 months ago I used some of these same indicators while we were near the top to say, “With three of these indicators looking flat out ugly, I can only think the bad is not over”. If only I paid attention to my own analysis I’d have save myself a lot of money and if I had really paid attention I’d be up more by profiting from the downside. Knowing what the indicators predicted and ignoring it was just stupid. I plan to be smarter on the way up and when I see the same indicators for the way down the next time again.


The market may bounce back a little from the lows but look for years of sideways to down trending market, this is just my opinion. We shall see how it goes.
The regression of our stock market is based upon our economy.
This stock looks like something you could pull an iron condor out on though!
Forced to love Options trading!