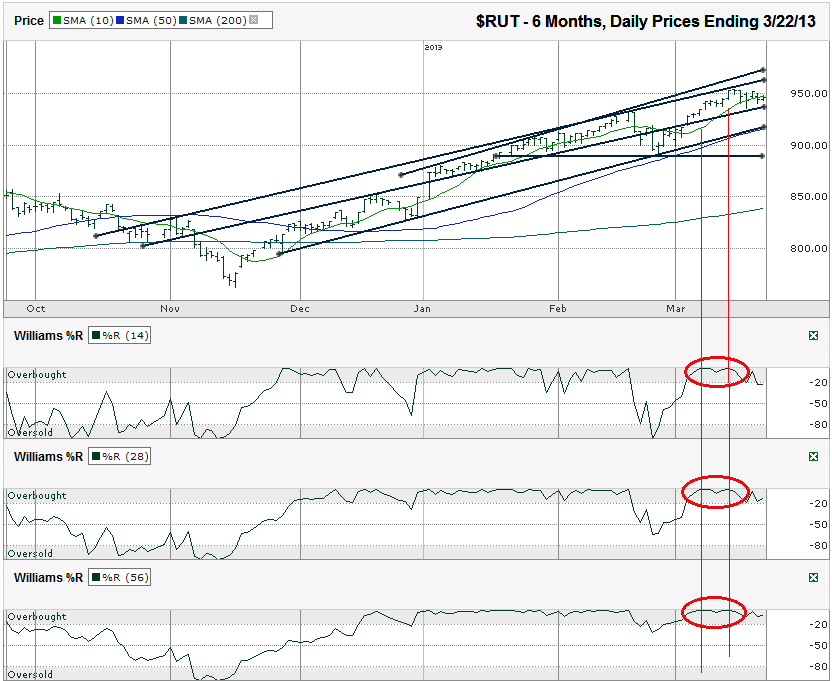
This Russell 2000 ($RUT) chart shows the past 6 months of daily prices after the index finished the week at 946.27 on Friday, March 22, 2013.
I called a bottom on the Russell 2000 index the last time I charted it and said to expect a bounce within two to three days. That was four days before the actual bottom, one day outside of my predicted date range. The main indicator that prompted that call is giving the reverse signal now. Actually, the Williams %R indicator has given that signal twice recently and has already started to move lower. As with any technical indicator, the trick is always trying to figure out how much lower the index, stock or ETF can move.
A long trend line I drew cuts through much of the past five months. It has acted as support and then resistance, followed by support and resistance again. The same line is going to have a chance to act as a support one more time this coming week. All trend lines stop working eventually and this one has tended to be more of a speed bump than true support or resistance. The better trend line to watch might be around 915, close to the 50-day moving average (dma). It marks the trend line of higher lows that started in late November. A retracement to this line would be roughly 4% below the recent intraday high. That’s not much of a correction, but could be enough to bring buyers back into the market.
A move back down to the February low would be closer to a 5.5% correction. The Russell 2000 will have to go back to its year-to-date low, around 850, to get an 11% correction. The chance of any heavy selling below that is unlikely. To add to the “magic” of the 850 area, the 200-dma is ascending and could meet the falling index around there and help with support.
Another bump higher isn’t out of the question from these recent levels. The trend lines of higher highs show the potential of another 2-3% higher before hitting resistance again. That’s not a lot of upward potential for the amount of downside risk that’s available. If there is a push back to upper end of RUT’s trading channel, expect a bigger sell-off soon after. This is the type of chart set-up that has proven to hurt risk-takers in the past. We’ll see if history repeats.


